2025 Automotive Visualization Market Growth: United States, Germany, and Japan Leading Innovation Worth $16.91 Billion
Experience rapid growth in the Automotive Visualization Market as the United States, Germany, and Japan lead technological innovation with advanced 3D rendering and virtual showroom solutions.
- Last Updated:
Automotive Visualization Market Forecast for 2025 with Q1 and Q2 Predictions
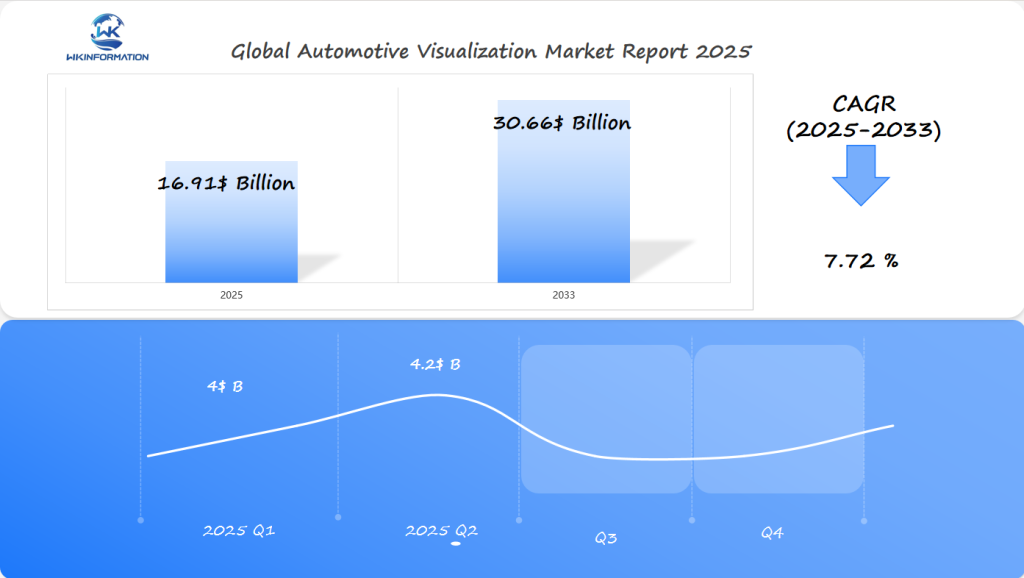
The global Automotive Visualization market is estimated to reach USD 16.91 billion in 2025, growing at a CAGR of 7.72% from 2025 to 2033. For Q1 2025, the market is expected to generate around USD 4 billion, with Q2 seeing a slight increase to USD 4.2 billion. The United States, Germany, and Japan are key markets, driven by the increasing demand for advanced driver assistance systems (ADAS), autonomous driving technologies, and in-car infotainment solutions.
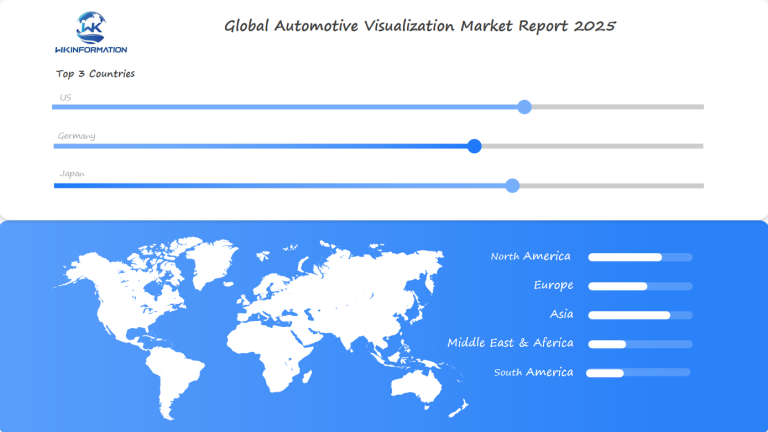
The U.S. remains a dominant force with significant investment in autonomous vehicles and smart car technologies, while Germany and Japan, with their strong automotive industries, continue to push for innovations in vehicle safety and navigation systems. As the automotive industry transitions toward more connected and automated vehicles, the need for advanced visualization solutions will continue to rise in these regions.
Upstream and Downstream Analysis in the Automotive Visualization Market
The automotive visualization market is a complex mix of technology and strategy. It shows how software makers, hardware creators, and service providers work together. This teamwork drives the market’s growth.
- Software development platforms
- Sensor and camera technology manufacturers
- Display interface designers
- Automotive original equipment manufacturers (OEMs)
End-User Demand Patterns
What users want is changing the market. Car makers are focusing on new tech to make driving safer and more enjoyable. People want digital parts of cars to work smoothly with the car itself.
Market Dynamics Transformation
The market is changing fast, thanks to new tech. There’s a big push for augmented reality, predictive systems, and smart interfaces.
- More focus on showing data as it happens
- Using artificial intelligence
- Making it easier for users to interact
This means car tech will get smarter, more responsive, and easier to use. It will meet the needs of users in all parts of the market.
Key Trends Shaping the Automotive Visualization Market in 2025
The world of automotive visualization is changing fast. New technologies are changing how cars are made, sold, and experienced. AR/VR in cars is leading this change, making old ways of doing things outdated.
Several key trends are set to reshape the automotive visualization market in 2025:
- AI-powered visualization is speeding up design and making digital prototypes more accurate
- The virtual prototype market is expected to grow from $0.79 billion in 2024 to $0.97 billion in 2025
- The artificial intelligence rendering market is expected to reach $2 billion in 2025
Emerging Technology Integration
AI and visualization are coming together in new ways in car design. Digital twin technology is getting better, letting makers test and improve car performance in a virtual world.
“The future of automotive design lies in the seamless integration of virtual and physical worlds” – Automotive Innovation Experts
Market Dynamics and Growth Drivers
North America is leading in virtual prototypes, while Asia-Pacific is growing fast. The main reasons for growth are:
- More demand for advanced product simulation
- Lower costs for digital prototypes
- More rules pushing for new ideas
Big names like NVIDIA, Siemens AG, and Qualcomm are leading in AR/VR and AI for cars. They’re changing the car world with their tech.
Restrictions and Challenges Facing the Automotive Visualization Market
The automotive visualization market faces big challenges that slow its growth. Technical issues and high costs are key factors. These factors shape how the industry grows.
- High initial investment requirements for advanced visualization technologies
- Complex hardware and software integration
- Performance demands for realistic rendering
- Ongoing maintenance and update expenses
Technical Performance Barriers
The market has big technical hurdles. Creating top-notch visualization systems needs advanced computers. Advanced rendering techniques require powerful GPU capabilities and real-time processing technologies.
Economic Constraints
High costs slow down market growth. Small and medium businesses find it hard to afford new tech. The costs include:
- Hardware infrastructure
- Software development
- Continuous technology upgrades
- Training specialized personnel
Market Penetration Challenges
Despite challenges, the future looks bright. By 2030, the extended reality market could hit over $1.1 trillion. This shows there’s a chance for growth.
| Challenge Category | Primary Impact | Potential Mitigation |
| Technical Limitations | Performance constraints | Advanced computational technologies |
| Cost Barriers | Market entry restrictions | Scalable investment models |
| Integration Complexity | Technological compatibility | Standardized visualization frameworks |
To move forward, we need teamwork. Tech companies, car makers, and research groups must work together. They should aim to make visualization tech more affordable and accessible.

Geopolitical Influences on the Automotive Visualization Industry
The automotive visualization industry is at a key point. It’s where tech meets global politics. These factors are changing how car makers use new tech.
Geopolitical influences are making big changes in the automotive visualization market. They do this through several ways:
- Trade policies create new investment paths
- International collaborations bridge tech gaps
- Strategic partnerships between car makers
- Cross-border tech transfer initiatives
Global Strategic Technological Partnerships
Countries like the United States, Germany, and Japan are leading the way. They’re doing this through strategic partnerships. These partnerships use each country’s strengths in tech to speed up innovation.
The United States is set to keep its 35% market share. This shows its leadership in car tech. Geopolitical factors are key in shaping the market. Trade deals and tech sharing programs are becoming more important.
Market Transformation Mechanisms
About 40% of car executives see geopolitics as key to their tech plans. International trade policies are shaping tech development. This opens up new chances for tech sharing across borders.
Types of Automotive Visualization Technologies and Their Applications
The automotive world is changing fast with new visualization tech. 3D modeling and real-time configurators are changing how cars are made, sold, and seen by buyers.
Automotive visualization apps have grown a lot. They offer new solutions in many areas:
- Design and Prototyping: Advanced 3D modeling lets engineers make detailed car designs with great accuracy
- Virtual Showrooms: Interactive sites where customers can customize and check out cars online
- Augmented Reality Maintenance: Guides for technicians to fix cars
- Training and Simulation: Realistic training for car professionals
Real-Time Configuration Technologies
Real-time configurators have changed how customers interact with cars. These digital tools let buyers pick colors, features, and more instantly. They show everything in high detail.
Emerging Visualization Trends
The virtual prototype market is expected to jump from $0.79 billion in 2024 to $0.97 billion in 2025. This shows how big a deal visualization tech is in car design and marketing.
Expanding Applications of Automotive Visualization in Advanced Driver Assistance Systems (ADAS)
The automotive world is changing fast, thanks to new ADAS visualization tech. Today’s cars have advanced systems that give drivers a better view of the road. They also share important info in real-time.
Heads-up displays (HUDs) play a big role in ADAS. They show key driving info right on the windshield. This lets drivers see important details without taking their eyes off the road.
Key Applications of Sensor Data Visualization
- Real-time camera and radar system overlays
- Advanced navigation guidance interfaces
- 360-degree environmental awareness displays
- Predictive collision warning systems
Using sensor data visualization is changing how we drive. Cutting-edge ADAS visualization technologies turn complex data into easy-to-understand visuals. This makes driving safer and more enjoyable.
Technological Innovations Driving ADAS Development
By 2027, more than half of car makers will use digital twin tech. This will help improve ADAS designs. It shows how fast tech is advancing in this important safety area.
Global Market Overview: Automotive Visualization Performance Worldwide
The automotive visualization market is growing fast worldwide. Recent market analysis shows big growth in virtual prototypes. Market values are expected to soar in different parts of the world.
Looking at the global market, we find some key points:
- Market value expected to reach $30.66 billion by 2033
- Compound annual growth rate (CAGR) of 7.72%
- Projected growth reach $16.91 billion in 2025
Regional Market Dynamics
Regional market shares show a detailed picture of automotive visualization. North America is leading, while Asia-Pacific is growing the fastest. Companies like Siemens AG, NVIDIA Corporation, and Qualcomm Technologies Inc. are pushing innovation and growth.
“The future of automotive visualization lies in integrating advanced technologies like digital twin and predictive analytics” – Industry Expert
Future growth looks strong, thanks to more digital tech and advanced tools. These are being used in car design, development, and simulation.
USA Automotive Visualization Market: Key Developments and Market Insights
The United States automotive visualization market is growing fast. This growth comes from new technologies and smart moves by top companies. Places like Silicon Valley are key in making these technologies better.
Some big trends are shaping the market:
- More money going into advanced driver assistance systems (ADAS)
- Augmented reality (AR) is becoming a big part of car design
- The market is growing fast in high-tech car areas
Technological Innovation Landscape
WayRay’s Holograktor car is a big step forward. It has a True AR heads-up display (HUD) that shows interactive visuals on the windshield. This shows how advanced the USA market is getting in automotive visualization.
Market Dynamics
The market is expected to grow a lot. Technologies like extended reality could hit $1.1 trillion by 2030. Companies are using XR for design, prototyping, and to make driving safer with advanced visuals.
Industry Leaders and Innovations
Big names in cars and tech are pushing the market forward. They’re investing in AI and visualization tools. This opens up new ways for companies to change car design and how we use them.
Germany Automotive Visualization Market: Trends, Innovations, and Forecasts
The German automotive visualization market is leading in tech innovation. It’s changing how cars are designed and made. Germany’s top engineering skills are key to these new visualization technologies.
Important changes in the German market include big R&D efforts. These focus on new ways to see and make cars. Companies use the latest tech to improve car design and make driving more fun. The virtual prototype market is growing fast, with German makers leading the way.
Technological Breakthroughs in Automotive Visualization
- Advanced Computer-Aided Design (CAD) systems
- Augmented reality visualization tools
- Digital twin technologies for precise engineering
- Real-time simulation platforms
German trends show a strong focus on advanced visualization solutions. Car makers are putting a lot of money into research. They aim to link digital design with real-world making, making production better and more creative.
“Germany’s automotive visualization sector represents the pinnacle of technological innovation and engineering excellence.”
Artificial intelligence and machine learning are making big waves in visualization tech. German companies are at the forefront of creating new car visualization solutions. These solutions will change how cars are designed, tested, and made.
Japan Automotive Visualization Market: Growth Opportunities and Key Factors
The Japanese automotive visualization market is at the forefront of tech innovation. It uses its rich engineering history to drive market growth. Technological advancements make Japan a global leader in automotive solutions.
Japan’s approach to market development is unique. It shows how cultural influences shape tech innovation. The nation’s focus on precision and quality leads to big investments in visualization tech. This tech changes how we experience cars.
Key Drivers of Market Growth
- Advanced driver assistance systems (ADAS) development
- High-precision sensor technologies
- Robust research and development infrastructure
- Strong collaboration between automotive manufacturers and technology firms
Cultural factors are key in Japan’s automotive visualization market. Kaizen principles of continuous improvement push engineers to create better visualization solutions. These solutions improve driver safety and vehicle performance.
Technological Innovation Landscape
Japanese companies lead in visualization tech. They use artificial intelligence, machine learning, and advanced optical systems. These innovations set global standards for automotive visualization, showing Japan’s tech leadership.
What’s Next for the Automotive Visualization Market in 2025?
The automotive visualization market is on the verge of a big change. New technologies like extended reality (XR) will change how we design, make, and use cars.
New technologies are making big waves for 2025. The global extended reality market is expected to hit $1.1 trillion by 2030. The car industry will play a big part in this change.
Key Technological Advancements
- AR-powered heads-up displays (HUDs) improving driver safety
- Advanced AI-driven rendering systems for vehicle design
- Immersive XR experiences in automotive manufacturing
WayRay’s Holograktor car shows what’s possible with true augmented reality. It has interactive windshield projections that mix digital info with real driving.
Market Transformation Indicators
| Technology | Potential Impact | Market Growth |
| AR Maintenance Systems | Reduce repair errors | 15.7% CAGR by 2025 |
| XR Design Tools | Accelerate prototype development | Projected 20% efficiency increase |
| AI Visualization | Enhance user experience | Expected $1.8 billion market by 2029 |
In 2025, the car industry will see advanced technologies. These will mix the real and digital worlds. Companies using XR and AI will lead this change.
Competitive Landscape of the Automotive Visualization Market
Business strategies in this field are getting more complex. Top companies are creating top-notch software and hardware. They’re focusing on improving driver experience, safety, and self-driving car tech.
- Siemens Digital Industries Software – Germany
- Dassault Systèmes SE – France
- Autodesk, Inc. – USA
- PTC Inc. – USA
- NVIDIA Corporation – USA
- Unity Technologies, Inc. – USA
- SAP SE – Germany
- Robert Bosch GmbH – Germany
- Continental AG – Germany
- Volkswagen AG – Germany
Overall
| Report Metric | Details |
|---|---|
| Report Name | Global Automotive Visualization Market Report |
| Base Year | 2024 |
| Segment by Type |
· 3D Modeling · Real-time Configurators |
| Segment by Application |
· Passenger Car · Commercial Vehicle |
| Geographies Covered |
· North America (United States, Canada) · Europe (Germany, France, UK, Italy, Russia) · Asia-Pacific (China, Japan, South Korea, Taiwan) · Southeast Asia (India) · Latin America (Mexico, Brazil) |
| Forecast units | USD million in value |
| Report coverage | Revenue and volume forecast, company share, competitive landscape, growth factors and trends |
The Automotive Visualization Market is set for significant growth, with the United States, Germany, and Japan leading the way in innovation. By 2025, the market is projected to reach a value of $16.91 billion, fueled by the growing demand for advanced driver assistance systems (ADAS), autonomous vehicles, and enhanced in-car experiences. Automotive visualization technologies, including augmented reality (AR) displays, heads-up displays (HUD), and 3D mapping, are transforming how drivers interact with their vehicles. These innovations improve safety, navigation, and user experience, while also supporting the development of fully autonomous driving systems. As automakers and tech companies continue to invest in cutting-edge technologies, these leading nations will continue to drive the market’s growth and technological advancements.
Global Automotive Visualization Market Report (Can Read by Free sample) – Table of Contents
Chapter 1: Automotive Visualization Market Analysis Overview
- Competitive Forces Analysis (Porter’s Five Forces)
- Strategic Growth Assessment (Ansoff Matrix)
- Industry Value Chain Insights
- Regional Trends and Key Market Drivers
- Vacuum Arc RemeltingMarket Segmentation Overview
Chapter 2: Competitive Landscape
- Global Automotive Visualizationplayers and Regional Insights
- Key Players and Market Share Analysis
- Sales Trends of Leading Companies
- Year-on-Year Performance Insights
- Competitive Strategies and Market Positioning
- Key Differentiators and Strategic Moves
Chapter 3: Automotive Visualization Market Segmentation Analysis
- Key Data and Visual Insights
- Trends, Growth Rates, and Drivers
- Segment Dynamics and Insights
- Detailed Market Analysis by Segment
Chapter 4: Regional Market Performance
- Consumer Trends by Region
- Historical Data and Growth Forecasts
- Regional Growth Factors
- Economic, Demographic, and Technological Impacts
- Challenges and Opportunities in Key Regions
- Regional Trends and Market Shifts
- Key Cities and High-Demand Areas
Chapter 5: Automotive Visualization Emerging and Untapped Markets
- Growth Potential in Secondary Regions
- Trends, Challenges, and Opportunities
Chapter 6: Product and Application Segmentation
- Product Types and Innovation Trends
- Application-Based Market Insights
Chapter 7: Automotive Visualization Consumer Insights
- Demographics and Buying Behaviors
- Target Audience Profiles
Chapter 8: Key Findings and Recommendations
- Summary ofAutomotive Visualization Market Insights
- Actionable Recommendations for Stakeholders
Access the study in MULTIPLEFORMATS
Didn’t find what you’re looking for?
TALK TO OUR ANALYST TEAM
Need something within your budget?
NO WORRIES! WE GOT YOU COVERED!
Call us on: +1-866-739-3133
Email: infor@wkinformation.com
What is automotive visualization and why is it important?
Automotive visualization uses advanced 3D rendering and digital tools. It creates realistic vehicle representations. This helps manufacturers, dealerships, and consumers interact with designs online.
It’s key for improving design, marketing, and customer engagement in the car industry.
How are augmented reality (AR) and virtual reality (VR) transforming automotive visualization?
AR and VR are changing automotive visualization by offering immersive experiences. They include virtual car configurators and interactive showrooms. These technologies let customers customize cars and explore features digitally.
Which countries are leading in automotive visualization technologies?
The United States, Germany, and Japan lead in automotive visualization. They have strong car industries and invest in advanced visualization solutions.
What challenges does the automotive visualization market face?
The market faces high initial costs and technical challenges in rendering graphics. It needs advanced hardware and software. It also needs constant updates to meet new standards and expectations.
How are visualization technologies supporting Advanced Driver Assistance Systems (ADAS)?
Visualization technologies support ADAS through HUDs and sensor data. They provide real-time information. This enhances driver awareness and supports autonomous vehicles.
What role does artificial intelligence play in automotive visualization?
Artificial intelligence improves automotive visualization. It enables advanced rendering, predictive design, and personalized experiences. It also processes data for realistic digital car representations.
What types of automotive visualization technologies exist?
There are 3D modeling, real-time configurators, virtual showrooms, and AR maintenance guides. These tools are used in design, marketing, sales, and customer engagement.
How are geopolitical factors influencing automotive visualization?
Geopolitics affects automotive visualization through trade policies and international collaborations. It impacts technology transfer and research partnerships. These factors shape the global spread of visualization technologies.
What future trends are expected in automotive visualization by 2025?
Future trends include more immersive AR/VR and AI-driven rendering. There will be better integration with electric and autonomous vehicles. Customization options will improve, and design and marketing tools will get more sophisticated.
How are consumers benefiting from automotive visualization technologies?
Consumers enjoy enhanced online and offline car exploration. They get personalized configuration experiences and make informed purchases. They spend less time in showrooms and can see cars in different settings before buying.
RECENT REPORTS
Our clients